Integrated Supply Forecast
Long-term production forecasts with analyst-controlled scenarios.
I developed a monthly forecast of US and Canadian oil, natural gas, and natural gas liquids wellhead production over a 20-year horizon. The system combines well-level decline curve analysis across about 150 Production Reporting Areas with an analyst interface for exploring forecast scenarios. I built it first in MATLAB, then rebuilt the entire process in Python with pandas and a Streamlit dashboard.
01 / The Challenge
A national production outlook starts with individual wells. Raw state-reported well data had to be cleaned and classified before it could support consistent monthly forecasts across commodities and geographies.
The forecast covered about 150 Production Reporting Areas: granular regions within major basins, plus standalone areas for smaller producing regions. Results then rolled up into larger areas and US and Canadian totals.
Analysts needed a way to adjust the automatically generated monthly baseline and explore alternative scenarios.
System view
02 / The Approach
- Built a data pipeline that pulled vendor-supplied, state-reported well data from a local database, cleaned it, and categorized wells by geography, well type, and other attributes. Aggregated the data into monthly production totals by geography.
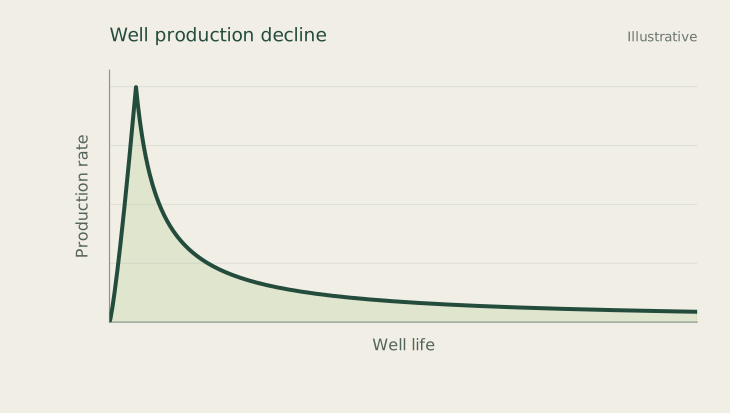
- Developed the original MATLAB forecast using well-level decline curve analysis to project monthly production over 20 years.
- Used oil and gross gas data as primary inputs, shrink factors to derive dry gas, and gallons-per-Mcf (GPM) conversion factors to derive natural gas liquids from gross gas.
- Built a MATLAB GUI that let analysts adjust decline-curve parameters for each Production Reporting Area, along with shrink and GPM assumptions, to run scenarios from the monthly baseline.
- Rebuilt the full process in Python using pandas, then recreated the analyst interface as a Streamlit dashboard hosted on a local server.
03 / The Impact
- Delivered an integrated, long-term outlook for oil, natural gas, and natural gas liquids production across the US and Canada.
- Connected well-level modeling to regional and national production forecasts across about 150 Production Reporting Areas.
- Enabled analysts to explore scenarios by changing modeling assumptions through a dedicated interface.
- Rebuilt both the forecasting process and its analyst interface from MATLAB into Python, pandas, and Streamlit.